The figure below shows a consumer maximizing utility at two different prices (the left panel) and the consumer's demand for good X at the same two prices of good X (the right panel) .The price of good Y is $4.50.When the price of X increases from point S to point R along the demand curve,the substitution effect of the price increase is ________. 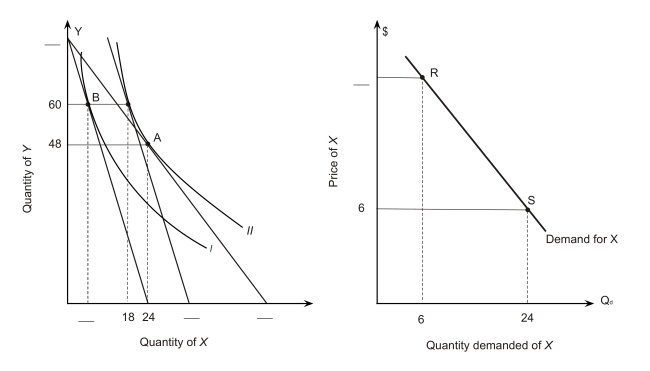
A) -6
B) -7.5
C) -8
D) -9
E) -10
Correct Answer:
Verified
Q86: The following figure shows a portion of
Q87: In a world with only two goods
Q88: The figure below shows a consumer maximizing
Q89: The following figure shows a portion of
Q90: The following figure shows a portion of
Q92: The figure below shows a consumer maximizing
Q93: The figure below shows a consumer maximizing
Q94: The following figure shows a portion of
Q95: The following figure shows a portion of
Q96: The figure below shows a consumer maximizing
Unlock this Answer For Free Now!
View this answer and more for free by performing one of the following actions

Scan the QR code to install the App and get 2 free unlocks

Unlock quizzes for free by uploading documents