TABLE 2-18
The following table presents total retail sales in millions of dollars for the leading apparel companies during April 2008 and April 2009.
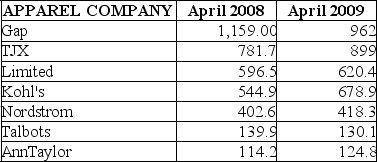
-Referring to Table 2-18, construct a side-by-side bar chart.
Correct Answer:
Verified
Q267: TABLE 2-15
The table below contains the number
Q268: TABLE 2-16
The figure below is the ogive
Q269: TABLE 2-18
The following table presents total retail
Q270: TABLE 2-17
The figure below is the percentage
Q271: TABLE 2-18
The following table presents total retail
Q272: TABLE 2-15
The table below contains the number
Q273: TABLE 2-18
The following table presents total retail
Q274: TABLE 2-17
The figure below is the percentage
Q275: TABLE 2-15
The table below contains the number
Q277: TABLE 2-17
The figure below is the percentage
Unlock this Answer For Free Now!
View this answer and more for free by performing one of the following actions

Scan the QR code to install the App and get 2 free unlocks

Unlock quizzes for free by uploading documents