The graph below shows the relative changes in concentration of glucose, fatty acids, and ketone bodies during 40 days of starvation. Choose the answer that correctly labels the data on the graph. 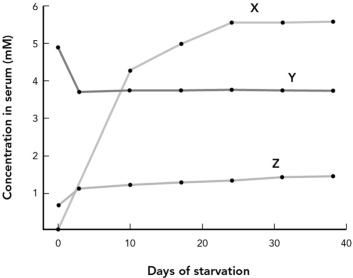
A) X = fatty acids; Y = glucose; Z = ketone bodies
B) X = glucose; Y = fatty acids; Z = ketone bodies
C) X = ketone bodies; Y = glucose; Z = fatty acids
D) X = ketone bodies; Y = fatty acids; Z = glucose
Correct Answer:
Verified
Q21: Which of the following changes in metabolic
Q23: The set point can be increased as
Q27: During periods of starvation,gluconeogenesis increases in the
Q30: Which of the following neurons is a
Q31: The average amount of adipose tissue the
Q32: Neuronal samples from wild-type mice were monitored
Q34: What might occur if a mutation
Q34: Enzyme activities after PPAR signaling were monitored
Q35: When basal metabolic rates are decreased and
Q36: Which of the following is NOT
Unlock this Answer For Free Now!
View this answer and more for free by performing one of the following actions

Scan the QR code to install the App and get 2 free unlocks

Unlock quizzes for free by uploading documents