Multiple Choice
Figure 4-5 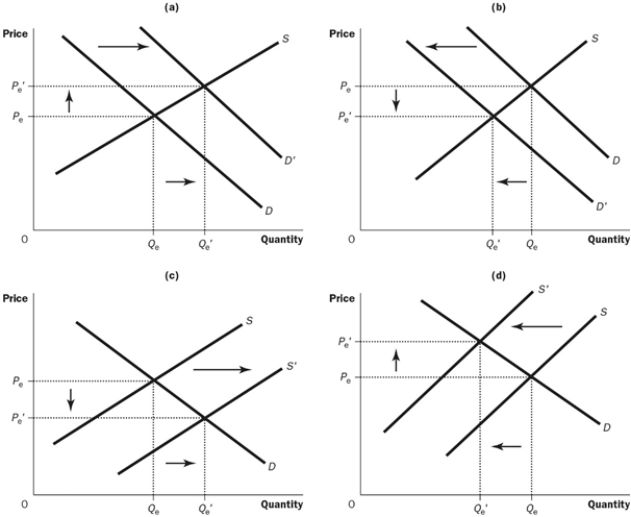
-Refer to the Figure 4-5. Which of the four graphs represents the market for oranges after a deep freeze impacts much of the Florida orange harvest?
A) graph A
B) graph B
C) graph C
D) graph D
Correct Answer:
Verified
Related Questions
Q159: Figure 4-1 Q160: Figure 4-3 Q161: What does supply-and-demand analysis involve? Q162: What will result from an increase in Q163: Figure 4-4 Q165: Figure 4-4 Q166: Suppose cupcakes are currently selling for $8 Q167: Why do markets move toward equilibrium of Q168: Figure 4-4 Q169: Figure 4-5 Unlock this Answer For Free Now! View this answer and more for free by performing one of the following actions Scan the QR code to install the App and get 2 free unlocks Unlock quizzes for free by uploading documents![]()
![]()
A) comparisons of![]()
![]()
![]()
![]()

