Multiple Choice
Figure 4-5 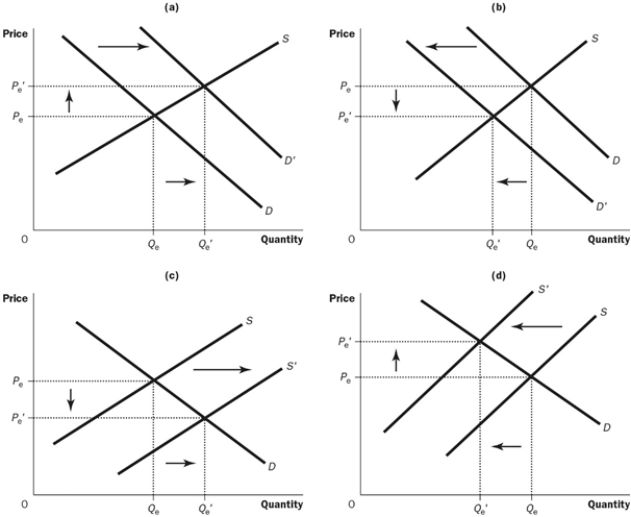
-Refer to the Figure 4-5. Which of the following is shown in Graph A?
A) an increase in demand
B) an increase in quantity demanded
C) a decrease in the number of buyers
D) a decrease in consumer income
Correct Answer:
Verified
Related Questions
Q164: Figure 4-5 Q165: Figure 4-4 Q166: Suppose cupcakes are currently selling for $8 Q167: Why do markets move toward equilibrium of Q168: Figure 4-4 Q170: What happens when there is a shortage Q171: Suppose you wish to analyze the change Unlock this Answer For Free Now! View this answer and more for free by performing one of the following actions Scan the QR code to install the App and get 2 free unlocks Unlock quizzes for free by uploading documents![]()
![]()
![]()

