The figure below shows the isocost lines and the isoquant map for a firm producing golf tees.
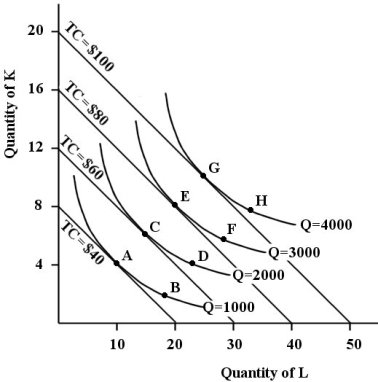 FIGURE 8- 6
-Refer to Figure 8- 6.As this firm is increasing its production of golf tees,it is experiencing returns to scale.
A) decreasing
B) diminishing
C) constant
D) increasing
E) Not determinable from the information provided.
Correct Answer:
Verified
Q6: TABLE 8-1 Q112: What is the definition of productivity? Q114: The figure below shows a family of Q115: Assume a firm is using 10 units Q117: FIGURE 8- 4 Q119: Suppose a firm is employing labour (L)and Q120: The figure below shows the isocost lines Q121: A downward- sloping LRAC curve will shift Unlock this Answer For Free Now! View this answer and more for free by performing one of the following actions Scan the QR code to install the App and get 2 free unlocks Unlock quizzes for free by uploading documents
![]()
A)the efficient![]()

