The diagram below shows supply and demand diagrams (S and D) for some product.The government then imposes an excise tax.The new supply curve is ST.
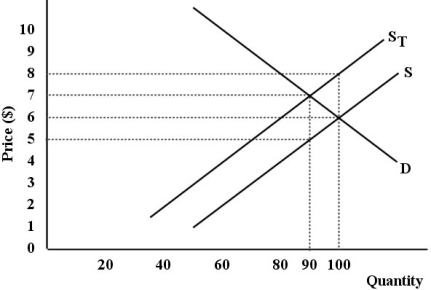 FIGURE 18- 4
-Refer to Figure 18- 4.What is the producers' revenue before the imposition of the tax?
A) $540
B) $500
C) $600
D) $630
E) $450
Correct Answer:
Verified
Q35: If one was concerned only with satisfying
Q36: According to Statistics Canada's definition,the percentage of
Q37: A tax that takes a higher percentage
Q38: Which of the following is an example
Q39: One of the guiding principles in Canada's
Q41: Consider a monopolist that is earning profits
Q42: Consider an income- tax system that requires
Q43: Suppose an additional "special" tax of $0.10
Q44: The figure below show a simplified version
Q45: The table below shows 2012 federal
Unlock this Answer For Free Now!
View this answer and more for free by performing one of the following actions

Scan the QR code to install the App and get 2 free unlocks

Unlock quizzes for free by uploading documents