The diagram below shows the marginal cost of pollution abatement for two firms,Firm X and Firm Y.
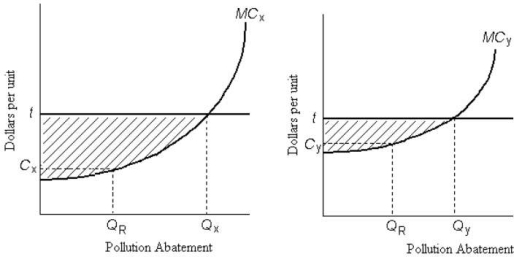 FIGURE 17- 4
-Refer to Figure 17- 4.Firms X and Y have an emissions tax of $t imposed on each unit of pollution they produce.If Firm X chooses to abate QX units of pollution,the total cost of its abatement is
A) area beneath the marginal cost of pollution abatement curve.
B) tax amount t multiplied by the level of pollution abatement,QX.
C) tax amount t multiplied by the maximum possible level of pollution abatement.
D) area beneath the marginal cost of pollution abatement curve up to QX.
E) area below the horizontal line at t and above the MC of pollution abatement curve.
Correct Answer:
Verified
Q19: The figure below shows the marginal benefit
Q69: An emissions tax (imposed on each unit
Q70: Consider an oil company extracting oil from
Q71: The table below shows the marginal
Q73: The diagram below shows the marginal cost
Q75: When considering an entire industry,the marginal benefit
Q76: Consider the following equation: GHG = GHG
Q77: When the marginal costs of pollution abatement
Q78: A pollution- control policy that,in principle,can perfectly
Q79: The diagram below shows a market for
Unlock this Answer For Free Now!
View this answer and more for free by performing one of the following actions

Scan the QR code to install the App and get 2 free unlocks

Unlock quizzes for free by uploading documents