The diagram below shows the marginal cost of pollution abatement for two firms,Firm X and Firm Y.
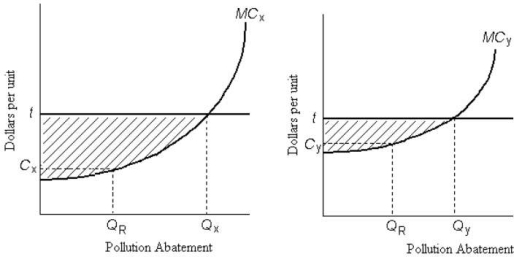 FIGURE 17- 4
-If emissions permits are traded freely between profit- maximizing firms in the private market,
A) the amount of pollution abatement will be identical to that which the firms would have willingly undertaken on their own.
B) marginal abatement costs will be equalized across firms.
C) each firm will face identical costs of pollution abatement.
D) there will be more than the optimal amount of pollution.
E) all firms will use identical pollution abatement technologies.
Correct Answer:
Verified
Q60: A paper mill discharges chemicals into a
Q61: The diagram below shows the marginal costs
Q62: When comparing a system of emission taxes
Q63: A paper mill discharges chemicals into a
Q64: The marginal benefit of reducing pollution and
Q66: When designing a policy to reduce polluting
Q67: The diagram below shows the marginal costs
Q68: Suppose a farm that is polluting an
Q69: An emissions tax (imposed on each unit
Q70: Consider an oil company extracting oil from
Unlock this Answer For Free Now!
View this answer and more for free by performing one of the following actions

Scan the QR code to install the App and get 2 free unlocks

Unlock quizzes for free by uploading documents