The diagram below shows the marginal costs of pollution abatement for two firms,Firm 1 and Firm 2.
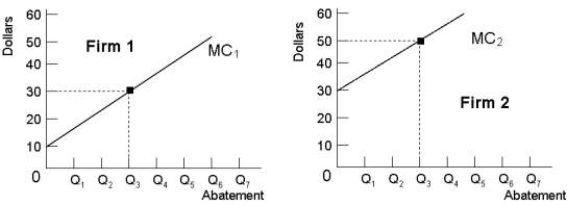 FIGURE 17- 5
-A paper mill discharges chemicals into a river which washes the shores of a downstream resort area.The private marginal cost,social marginal cost,and marginal benefit associated with the production of paper are given by the following equations: MCP = 5 + Q,MCS = 10 + 2Q,and MB = 35 - 0.5Q.The allocatively efficient level of output is _ units.
A) 15
B) 30
C) 10
D) 25
E) 0
Correct Answer:
Verified
Q56: Two firms,A and B,are legally required to
Q57: The main advantage of using market- based
Q58: All of the following are examples of
Q59: The diagram below shows the marginal cost
Q60: A paper mill discharges chemicals into a
Q62: When comparing a system of emission taxes
Q63: A paper mill discharges chemicals into a
Q64: The marginal benefit of reducing pollution and
Q65: The diagram below shows the marginal cost
Q66: When designing a policy to reduce polluting
Unlock this Answer For Free Now!
View this answer and more for free by performing one of the following actions

Scan the QR code to install the App and get 2 free unlocks

Unlock quizzes for free by uploading documents