The diagram below shows the marginal cost of pollution abatement for two firms,Firm X and Firm Y.
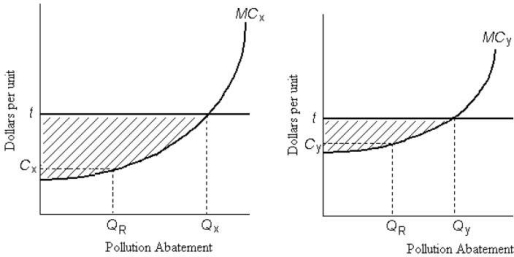 FIGURE 17- 4
-Refer to Figure 17- 4.Ignore the horizontal line at t.Suppose Firms X and Y are each abating QR units of pollution.If Firm X then reduces pollution by one unit and Firm Y increases pollution by one unit,then
A) the total cost of abatement remains the same but pollution falls.
B) total pollution remains the same but the total cost of abatement falls.
C) the total costs of abatement and the amount of pollution do not change.
D) total pollution remains the same but the total cost of abatement increases.
E) the total cost of abatement remains the same but pollution increases.
Correct Answer:
Verified
Q92: Automobile emissions standards are an example of
A)tradable
Q93: Suppose the government imposes a tax for
Q94: Suppose a firm producing roof shingles imposes
Q95: The countries that signed the Kyoto Protocol
Q96: A downward- sloping marginal benefit curve for
Q98: The diagram below shows a market for
Q99: An important reason that direct controls are
Q100: Refer to Figure 17- 4.Ignore the horizontal
Q101: The diagram below shows a market for
Q102: The diagram below shows a market for
Unlock this Answer For Free Now!
View this answer and more for free by performing one of the following actions

Scan the QR code to install the App and get 2 free unlocks

Unlock quizzes for free by uploading documents