The diagram below shows the marginal cost of pollution abatement for two firms,Firm X and Firm Y.
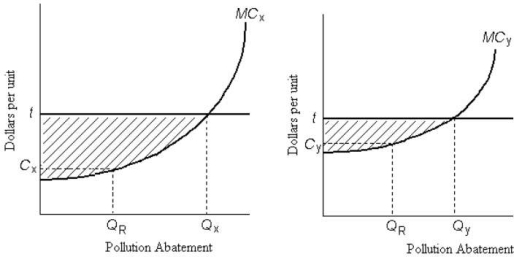 FIGURE 17- 4
-Refer to Figure 17- 4.Firms X and Y have an emissions tax of $t imposed on each unit of pollution they produce.Firm X will choose to abate pollution of units and Firm Y will choose to abate pollution of units.
A) 0; 0
B) QR; QR
C) QR; QY
D) QX; QR
E) QX; QY
Correct Answer:
Verified
Q51: Suppose a farm that is polluting an
Q81: The figure below shows the demand and
Q82: Given that different firms typically have different
Q83: The marginal benefit of reducing pollution in
Q84: The diagram below shows the marginal costs
Q85: The table below shows the marginal
Q87: Suppose a firm producing roof shingles imposes
Q88: The table below shows the marginal
Q90: A paper mill discharges chemicals into a
Q91: One promising strategy for efficiently addressing the
Unlock this Answer For Free Now!
View this answer and more for free by performing one of the following actions

Scan the QR code to install the App and get 2 free unlocks

Unlock quizzes for free by uploading documents