The figure below shows the demand and supply curves for pollution abatement.
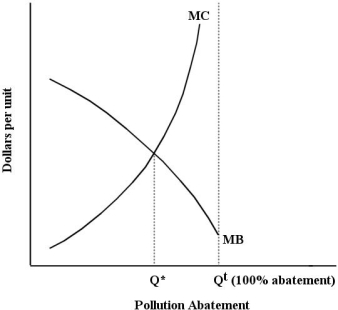 FIGURE 17- 3
-Refer to Figure 17- 3.The MB curve in this diagram is downward sloping because
A) the marginal benefit from a given amount of abatement will be higher,the higher the level of pollution abated.
B) the marginal damage generated by additional units of pollution is decreasing.
C) the marginal cost of additional units of pollution abatement is decreasing.
D) the marginal benefit from a given amount of abatement will be lower,the lower the level of pollution.
E) the marginal cost of additional units of pollution abatement increases as pollution abatement increases.
Correct Answer:
Verified
Q76: Consider the following equation: GHG = GHG
Q77: When the marginal costs of pollution abatement
Q78: A pollution- control policy that,in principle,can perfectly
Q79: The diagram below shows a market for
Q80: Zero environmental damage is probably
A)technologically possible but
Q82: Given that different firms typically have different
Q83: The marginal benefit of reducing pollution in
Q84: The diagram below shows the marginal costs
Q85: The table below shows the marginal
Q86: The diagram below shows the marginal cost
Unlock this Answer For Free Now!
View this answer and more for free by performing one of the following actions

Scan the QR code to install the App and get 2 free unlocks

Unlock quizzes for free by uploading documents