The diagram below shows the supply and demand for labour in a hypothetical town in northern British Columbia,with only one employer,a logging company.
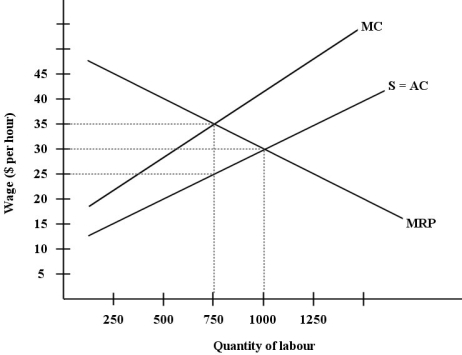 FIGURE 14- 4
-Refer to Figure 14- 4.Compared to the outcome in a competitive labour market,the wage and employment outcome in this town's monopsonistic labour market are as follows:
A) wages are lower by $5 per hour and employment is lower by 250 units of labour.
B) wages are lower by $10 per hour and employment is the same as the competitive outcome.
C) wages and employment are both the same as the competitive outcome.
D) wages are the same as the competitive outcome and employment is higher by 250 units of labour.
E) wages are higher by $10 per hour and employment is lower by 250 units of labour.
Correct Answer:
Verified
Q11: Suppose there is a competitive market for
Q12: The diagram below shows the supply and
Q13: Wage differentials due to cross- worker differences
Q15: Some people are concerned that "good" manufacturing
Q17: In general,in collective bargaining between a labour
Q18: The table below shows the labour
Q19: Consider a monopsonistic labour market.One hundred units

