The diagram below shows the supply and demand for labour in a hypothetical town in northern British Columbia,with only one employer,a logging company.
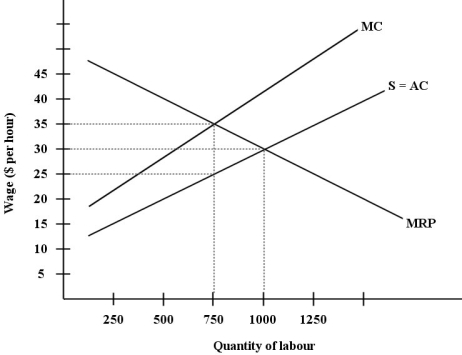 FIGURE 14- 4
-Refer to Figure 14- 4.The wage paid by this monopsonistic firm will be and employment will be _ .
A) below $25 per hour; below 750 units of labour
B) $25 per hour; 750 units of labour
C) $35 per hour; 750 units of labour
D) between $25 and $35 per hour; between 750 and 1000 units of labour
E) $30 per hour; 1000 units of labour
Correct Answer:
Verified
Q7: Suppose there is a competitive market for
Q8: Labour- market discrimination,which keeps one group of
Q9: The diagram below shows the supply and
Q10: The diagram below shows the supply and
Q11: Suppose there is a competitive market for
Q13: Wage differentials due to cross- worker differences
Q15: Some people are concerned that "good" manufacturing
Q16: The diagram below shows the supply and
Q17: In general,in collective bargaining between a labour
Q76: ![]()
Unlock this Answer For Free Now!
View this answer and more for free by performing one of the following actions

Scan the QR code to install the App and get 2 free unlocks

Unlock quizzes for free by uploading documents