The diagram below shows the supply and demand for labour in a hypothetical town in northern British Columbia,with only one employer,a logging company.
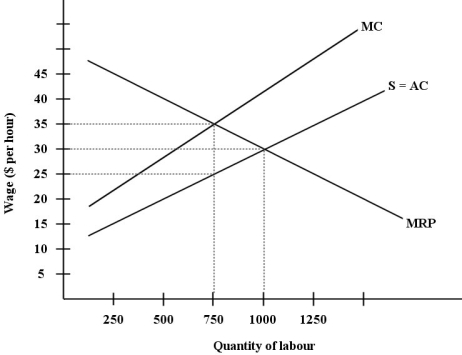 FIGURE 14- 4
-Suppose that a professional association strengthened the limits to entry into their profession and at the same time lengthened its required apprenticeship program.The likely effect would be that
A) both the demand and supply curves for labour would shift to the left.
B) there would be an increase in the quantity of labour supplied.
C) the supply curve for labour would shift to the right.
D) the supply curve for labour would shift to the left.
E) the demand curve for labour would shift to the right.
Correct Answer:
Verified
Q5: The fundamental dilemma facing labour unions is
A)members'
Q6: Certain professions limit the number of students
Q7: Suppose there is a competitive market for
Q8: Labour- market discrimination,which keeps one group of
Q9: The diagram below shows the supply and
Q11: Suppose there is a competitive market for
Q12: The diagram below shows the supply and
Q13: Wage differentials due to cross- worker differences
Q15: Some people are concerned that "good" manufacturing
Q76: ![]()
Unlock this Answer For Free Now!
View this answer and more for free by performing one of the following actions

Scan the QR code to install the App and get 2 free unlocks

Unlock quizzes for free by uploading documents