FIGURE 12- 2 The production possibilities boundary shows possible combinations of guns and butter that can be produced by a country.The lower diagram shows demand and supply for butter.
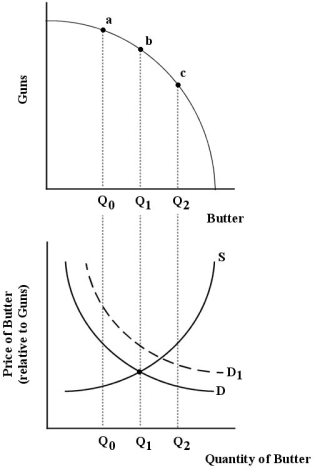
-Refer to Figure 12- 2.Suppose this economy is allocatively efficient at Q1 units of butter.Now suppose there is an increase in demand for butter from D to D1.After this shift in demand,
A) the marginal value to consumers of butter is less than the marginal cost to producers; the price of butter (relative to the price of guns) rises; the economy moves to output Q2 of butter and point (c) on the PPB.
B) the price of guns (relative to the price of butter) rises and the economy moves to point (a) on the PPB.
C) the marginal value to consumers of butter is greater than the marginal cost to producers; the price of butter (relative to the price of guns) rises; the economy moves to output Q2 of butter and point (c) on the PPB.
D) the increase in the price of butter (relative to the price of guns) will cause the demand curve to shift back down to D and allocative efficiency will be maintained.
E) the supply curve will shift up to S1 and allocative efficiency will be maintained.
Correct Answer:
Verified
Q20: FIGURE 12- 3 Q21: In Canada,the Competition Act specifies that in Q22: In which of the following situations would Q24: The diagram below shows the demand and Q26: The objective of government regulation and competition Q27: Suppose we compare two monopolists with identical Q28: In the long run,the imposition of average- Q30: The diagram below shows the market demand Q64: The diagram below shows the demand and Q85: Consider the following information for a regional![]()
Unlock this Answer For Free Now!
View this answer and more for free by performing one of the following actions

Scan the QR code to install the App and get 2 free unlocks

Unlock quizzes for free by uploading documents