The diagram below shows the market demand curve and the cost curves for a single firm.
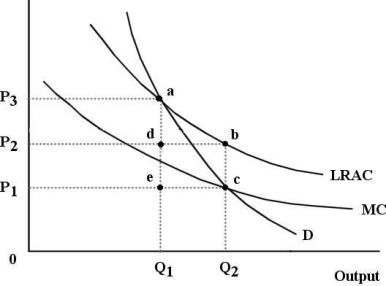 FIGURE 12- 6
-Refer to Figure 12- 6.Suppose this firm is being regulated using a policy of marginal- cost pricing.To maintain the resulting level of output
A) the demand curve would have to the left.
B) the average total cost curve would have to shift up.
C) the government would have to accept the allocative inefficiency associated with this level of output.
D) the government would have to subsidize the firm or it will eventually shut down.
E) the regulator would have to allow the firm to keep the monopoly profits at this level of output.
Correct Answer:
Verified
Q25: FIGURE 12- 2 The production possibilities boundary
Q26: The objective of government regulation and competition
Q27: Suppose we compare two monopolists with identical
Q28: In the long run,the imposition of average-
Q31: Allocative efficiency is actively sought
A)by profit- maximizing
Q32: The diagram below shows supply,demand,and quantity exchanged
Q33: If all firms are profit maximizers,then the
Q34: Consider the efficiency of various market structures
Q35: The diagram below shows supply,demand,and quantity exchanged
Q85: Consider the following information for a regional
Unlock this Answer For Free Now!
View this answer and more for free by performing one of the following actions

Scan the QR code to install the App and get 2 free unlocks

Unlock quizzes for free by uploading documents