The diagram below shows the market demand curve and the cost curves for a single firm.
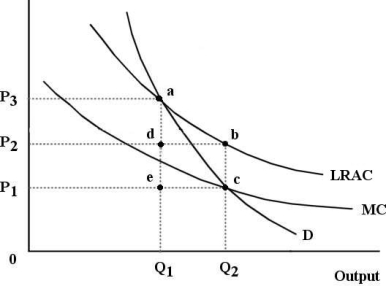 FIGURE 12- 6
-Refer to Figure 12- 6.Suppose this firm is being regulated using a policy of average- cost pricing.In this case,
A) the result is allocatively efficient because economic profits are zero.
B) the result is as close to the competitive outcome as possible.
C) the level of output is too low,but the price is allocatively efficient.
D) the result is allocatively inefficient because price exceeds marginal cost.
E) the result is allocatively inefficient because the marginal cost curve is downward sloping.
Correct Answer:
Verified
Q54: Choose the statement that best describes the
Q55: FIGURE 12- 2 The production possibilities boundary
Q56: FIGURE 12- 3 Q57: Productive efficiency (at the level of the Q58: The diagram below shows supply,demand,and quantity exchanged Q60: FIGURE 12- 3 Q61: FIGURE 12- 1 Consider three firms,A,B and Unlock this Answer For Free Now! View this answer and more for free by performing one of the following actions Scan the QR code to install the App and get 2 free unlocks Unlock quizzes for free by uploading documents![]()
![]()

