Multiple Choice
FIGURE 12- 3 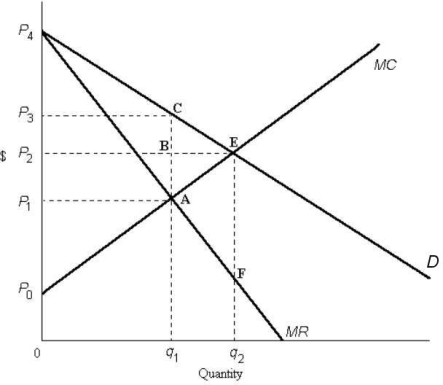
-Refer to Figure 12- 3.The area representing producer surplus at the monopoly equilibrium is outlined by
A) P0P2BA.
B) P0AP1.
C) 0P0Aq1.
D) P0P3CA.
E) 0P3Cq1.
Correct Answer:
Verified
Related Questions
Q55: FIGURE 12- 2 The production possibilities boundary
Q56: FIGURE 12- 3 Q57: Productive efficiency (at the level of the Q58: The diagram below shows supply,demand,and quantity exchanged Q59: The diagram below shows the market demand Q61: FIGURE 12- 1 Consider three firms,A,B and![]()
Unlock this Answer For Free Now!
View this answer and more for free by performing one of the following actions

Scan the QR code to install the App and get 2 free unlocks

Unlock quizzes for free by uploading documents