The diagram below shows the market demand curve and the cost curves for a single firm.
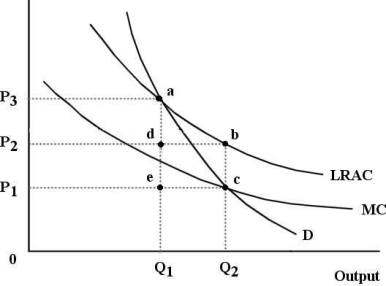 FIGURE 12- 6
-Refer to Figure 12- 6.Suppose this firm is being regulated using a policy of marginal- cost pricing.In this case,
A) the result is allocatively inefficient because the firm is suffering losses.
B) allocative efficiency is achieved because price equals marginal cost.
C) the result is allocatively inefficient because the marginal cost curve lies below the ATC curve.
D) allocative efficiency is achieved because profits are maximized.
E) the result is allocatively inefficient because the firm is earning profits.
Correct Answer:
Verified
Q60: FIGURE 12- 3 Q61: FIGURE 12- 1 Consider three firms,A,B and Q62: FIGURE 12- 3 Q63: FIGURE 12- 1 Consider three firms,A,B and Q64: If a regulatory agency imposes a lump- Q67: The diagram below shows the market demand Q68: The diagram below shows the market demand Q69: Allocative efficiency concerns Q70: The diagram below shows the market demand Q79: The diagram below shows the demand and![]()
![]()
A)producing outputs at lowest possible
Unlock this Answer For Free Now!
View this answer and more for free by performing one of the following actions

Scan the QR code to install the App and get 2 free unlocks

Unlock quizzes for free by uploading documents