The diagram below shows the market demand curve and the cost curves for a single firm.
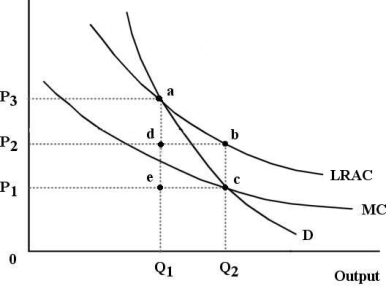 FIGURE 12- 6
-Which of the following is the definition of consumer surplus?
A) the value that consumers place on the last unit consumed of a good
B) the marginal value that consumers place on the last unit consumed of a good
C) the quantity consumed in excess of the allocatively efficient amount
D) the total value that consumers place on the quantity consumed of some good
E) the difference between the value that consumers place on a good and the payment they make to buy the good,summed over the quantity consumed
Correct Answer:
Verified
Q65: The diagram below shows the market demand
Q67: The diagram below shows the market demand
Q68: The diagram below shows the market demand
Q69: Allocative efficiency concerns
A)producing outputs at lowest possible
Q71: FIGURE 12- 1 Consider three firms,A,B and
Q72: An economy in which there are no
Q73: An economy will be allocatively efficient if
A)marginal
Q74: The diagram below shows cost and revenue
Q75: The diagram below shows supply,demand,and quantity exchanged
Q79: The diagram below shows the demand and
Unlock this Answer For Free Now!
View this answer and more for free by performing one of the following actions

Scan the QR code to install the App and get 2 free unlocks

Unlock quizzes for free by uploading documents