The diagram below shows cost and revenue curves for a natural monopoly producing electricity.Price is dollars per kilowatt hour and quantity is kilowatt hours per day.
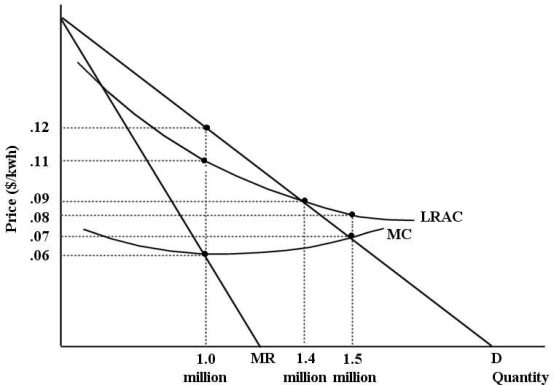 FIGURE 12- 7
-Refer to Figure 12- 7.Suppose this firm is being regulated using a policy of marginal- cost pricing.In this case,economic profits are equal to
A) - $28 000.
B) - $50 000.
C) $90 000.
D) - $15 000.
E) $0.
Correct Answer:
Verified
Q69: Allocative efficiency concerns
A)producing outputs at lowest possible
Q70: The diagram below shows the market demand
Q71: FIGURE 12- 1 Consider three firms,A,B and
Q72: An economy in which there are no
Q73: An economy will be allocatively efficient if
A)marginal
Q75: The diagram below shows supply,demand,and quantity exchanged
Q76: The diagram below shows supply,demand,and quantity exchanged
Q77: Consider two firms,A and B,that are producing
Q78: According to economist George Stigler,the process of
Q79: FIGURE 12- 1 Consider three firms,A,B and
Unlock this Answer For Free Now!
View this answer and more for free by performing one of the following actions

Scan the QR code to install the App and get 2 free unlocks

Unlock quizzes for free by uploading documents