The diagram below shows the market demand curve and the cost curves for a single firm.
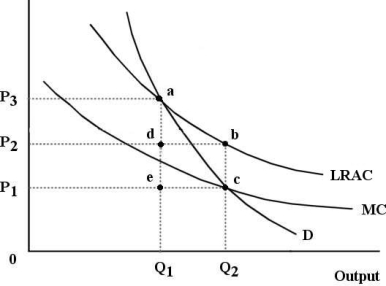 FIGURE 12- 6
-Refer to Figure 12- 6.Suppose this firm is being regulated using a policy of marginal- cost pricing.In this case,the firm would experience represented by the area .
A) losses; edbc
B) profits; edbc
C) profits; P2P3ad
D) losses; 0P2bQ2
E) losses; P1P2bc
Correct Answer:
Verified
Q63: FIGURE 12- 1 Consider three firms,A,B and
Q64: If a regulatory agency imposes a lump-
Q65: The diagram below shows the market demand
Q67: The diagram below shows the market demand
Q69: Allocative efficiency concerns
A)producing outputs at lowest possible
Q70: The diagram below shows the market demand
Q71: FIGURE 12- 1 Consider three firms,A,B and
Q72: An economy in which there are no
Q73: An economy will be allocatively efficient if
A)marginal
Q79: The diagram below shows the demand and
Unlock this Answer For Free Now!
View this answer and more for free by performing one of the following actions

Scan the QR code to install the App and get 2 free unlocks

Unlock quizzes for free by uploading documents