FIGURE 12- 2 The production possibilities boundary shows possible combinations of guns and butter that can be produced by a country.The lower diagram shows demand and supply for butter.
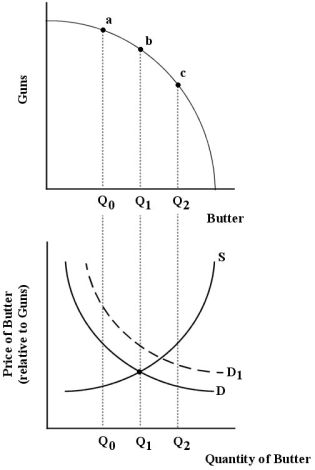
-Refer to Figure 12- 2.Suppose demand and supply for butter are shown by D and S,respectively.And suppose the economy is at point (a) on the production possibilities boundary.How can this economy move toward allocative efficiency?
A) increase the supply of guns
B) expand the production possibilities boundary outward
C) produce less butter,more guns
D) produce more butter,less guns
E) increase the demand for butter
Correct Answer:
Verified
Q75: The diagram below shows supply,demand,and quantity exchanged
Q76: The diagram below shows supply,demand,and quantity exchanged
Q77: Consider two firms,A and B,that are producing
Q78: According to economist George Stigler,the process of
Q79: FIGURE 12- 1 Consider three firms,A,B and
Q81: Consider a regulated natural monopoly,such as an
Q82: The diagram below shows the market demand
Q83: Choose the statement that best compares the
Q84: FIGURE 12- 3 Q85: FIGURE 12- 3 ![]()
![]()
Unlock this Answer For Free Now!
View this answer and more for free by performing one of the following actions

Scan the QR code to install the App and get 2 free unlocks

Unlock quizzes for free by uploading documents