The diagram below shows the market demand curve and the cost curves for a single firm.
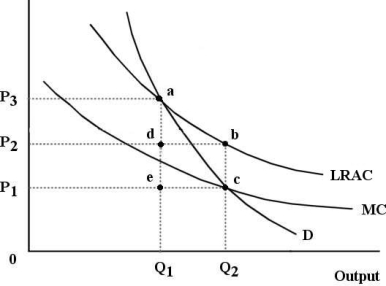 FIGURE 12- 6
-Refer to Figure 12- 6.Suppose the firm is being regulated using a policy of average- cost pricing.The resulting price and output would be
A) P3 and Q1.
B) P2 and Q2.
C) P1 and Q1.
D) P3 and Q2.
E) P1 and Q2.
Correct Answer:
Verified
Q77: Consider two firms,A and B,that are producing
Q78: According to economist George Stigler,the process of
Q79: FIGURE 12- 1 Consider three firms,A,B and
Q80: FIGURE 12- 2 The production possibilities boundary
Q81: Consider a regulated natural monopoly,such as an
Q83: Choose the statement that best compares the
Q84: FIGURE 12- 3 Q85: FIGURE 12- 3 Q86: The diagram below shows supply,demand,and quantity exchanged Q87: FIGURE 12- 3 Unlock this Answer For Free Now! View this answer and more for free by performing one of the following actions Scan the QR code to install the App and get 2 free unlocks Unlock quizzes for free by uploading documents![]()
![]()
![]()

