The diagram below shows the demand and supply curves in a perfectly competitive market.
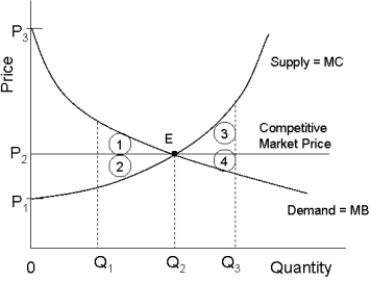 FIGURE 12- 5
-Refer to Figure 12- 5.If output in this market were Q1,the total loss in economic surplus relative to the competitive equilibrium would be illustrated by area
A) P1P3E.
B) 1 + 2.
C) 2.
D) 1 + 2 + 3 + 4.
E) 1.
Correct Answer:
Verified
Q90: All points on a country's production possibilities
Q91: FIGURE 12- 3 Q92: Consider a natural monopoly that has declining Q93: FIGURE 12- 3 Q94: An important defence of oligopoly as a Q96: The economic efficiency of a natural monopoly Q97: The diagram below shows cost and revenue Q98: The administrative agency established to enforce the Q99: Consider two firms,A and B,that are producing Q100: An economy will be allocatively efficient if![]()
![]()
A)the
Unlock this Answer For Free Now!
View this answer and more for free by performing one of the following actions

Scan the QR code to install the App and get 2 free unlocks

Unlock quizzes for free by uploading documents