The diagram below shows cost and revenue curves for a natural monopoly producing electricity.Price is dollars per kilowatt hour and quantity is kilowatt hours per day.
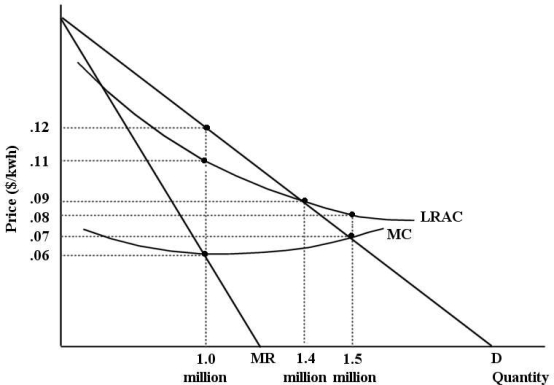 FIGURE 12- 7
-Refer to Figure 12- 7.Suppose this firm is being regulated using a pricing policy of average- cost pricing.In this case,economic profits are equal to
A) $126 000.
B) $0.
C) $6000.
D) $10 000.
E) $28 000.
Correct Answer:
Verified
Q92: Consider a natural monopoly that has declining
Q93: FIGURE 12- 3 Q94: An important defence of oligopoly as a Q95: The diagram below shows the demand and Q96: The economic efficiency of a natural monopoly Q98: The administrative agency established to enforce the Q99: Consider two firms,A and B,that are producing Q100: An economy will be allocatively efficient if Q101: The diagram below shows cost and revenue Q102: FIGURE 12- 3 ![]()
A)the![]()
Unlock this Answer For Free Now!
View this answer and more for free by performing one of the following actions

Scan the QR code to install the App and get 2 free unlocks

Unlock quizzes for free by uploading documents