The diagram below shows cost and revenue curves for a natural monopoly producing electricity.Price is dollars per kilowatt hour and quantity is kilowatt hours per day.
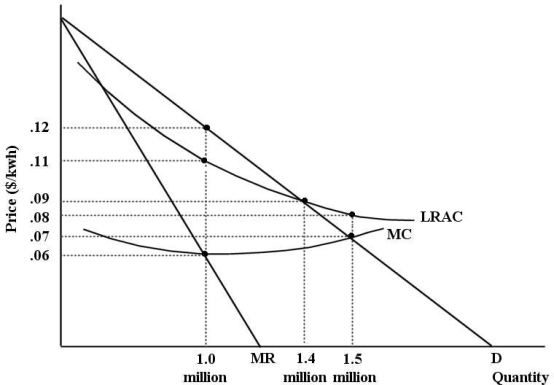 FIGURE 12- 7
-Refer to Figure 12- 7.Suppose this firm is being regulated using a policy of average- cost pricing.The resulting price and output would be per kwh and kwh per day.
A) $0.06; 1 million
B) $0.12; 1 million
C) $0.11; 1 million
D) $0.09; 1.4 million
E) $0.07; 1.5 million
Correct Answer:
Verified
Q96: The economic efficiency of a natural monopoly
Q97: The diagram below shows cost and revenue
Q98: The administrative agency established to enforce the
Q99: Consider two firms,A and B,that are producing
Q100: An economy will be allocatively efficient if
A)the
Unlock this Answer For Free Now!
View this answer and more for free by performing one of the following actions

Scan the QR code to install the App and get 2 free unlocks

Unlock quizzes for free by uploading documents