The diagram below shows cost and revenue curves for a natural monopoly producing electricity.Price is dollars per kilowatt hour and quantity is kilowatt hours per day.
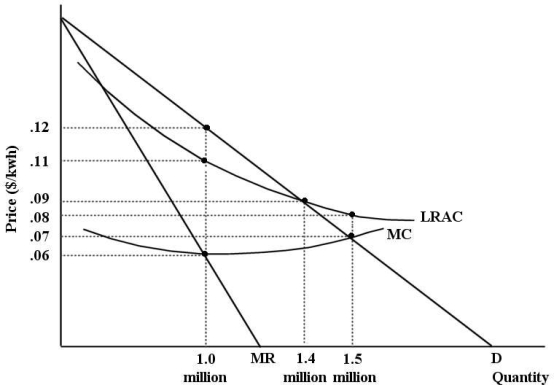 FIGURE 12- 7
-Refer to Figure 12- 7.Suppose this firm is being regulated using a policy of marginal- cost pricing.The resulting price and output would be per kwh and kwh per day.
A) $0.09; 1.4 million
B) $0.08; 1.5 million
C) $0.07; 1.5 million
D) $0.12; 1 million
E) $0.06; 1 million
Correct Answer:
Verified
Q105: A regulated monopoly that faces rising long-
Q106: The diagram below shows supply,demand,and quantity exchanged
Q107: The Canadian economy is achieving allocative efficiency
Q108: Consider an industry with three profit- maximizing
Q109: FIGURE 12- 1 Consider three firms,A,B and
Q110: The deadweight loss of monopoly is
A)any negative
Unlock this Answer For Free Now!
View this answer and more for free by performing one of the following actions

Scan the QR code to install the App and get 2 free unlocks

Unlock quizzes for free by uploading documents