FIGURE 12- 3 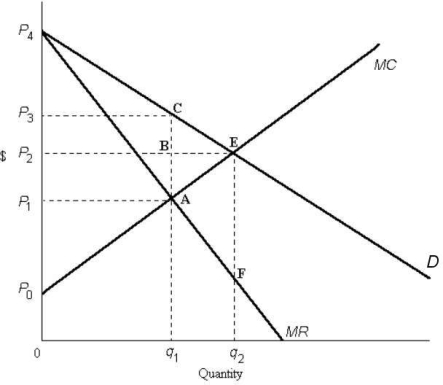
-Refer to Figure 12- 3.Comparing the monopoly equilibrium to the perfectly competitive equilibrium,the area representing the gain in producer surplus due to monopoly is outlined by
A) P3P4 less ABE.
B) P1P3CA less ACE.
C) P2P3CB less ABE.
D) P0P3CA less ACE
E) P2P4E.
Correct Answer:
Verified
Q105: A regulated monopoly that faces rising long-
Q106: The diagram below shows supply,demand,and quantity exchanged
Q107: The Canadian economy is achieving allocative efficiency
Q108: Consider an industry with three profit- maximizing
Q109: FIGURE 12- 1 Consider three firms,A,B and
Q110: The deadweight loss of monopoly is
A)any negative
Q112: FIGURE 12- 1 Consider three firms,A,B and
Q113: Consider the case of a natural monopoly
Q114: The diagram below shows cost and revenue
Q115: In the absence of other market failures,allocative
Unlock this Answer For Free Now!
View this answer and more for free by performing one of the following actions

Scan the QR code to install the App and get 2 free unlocks

Unlock quizzes for free by uploading documents