The diagram below shows demand and cost curves for a monopolistically competitive firm.
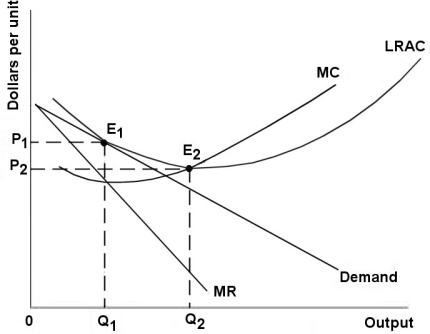 FIGURE 11- 3
-The following statements describe a cooperative equilibrium in an oligopoly where the firms are jointly maximizing profits by restricting output.Which statement is false?
A) MR > MC for each individual firm.
B) No individual firm will have an incentive to change output.
C) An individual firm could increase profits by cheating.
D) The firms in the industry will jointly be earning monopoly profits.
E) P > MC for each individual firm.
Correct Answer:
Verified
Q1: The diagram below shows selected cost and
Q3: FIGURE 11- 2 Q4: One prediction about monopolistic competition is that Q5: The diagram below shows demand and cost Q6: In a monopolistically competitive industry,the freedom of Q7: Suppose there are many independent dry cleaners Q8: A characteristic of a monopolistically competitive market Unlock this Answer For Free Now! View this answer and more for free by performing one of the following actions Scan the QR code to install the App and get 2 free unlocks Unlock quizzes for free by uploading documents![]()

