FIGURE 11- 2 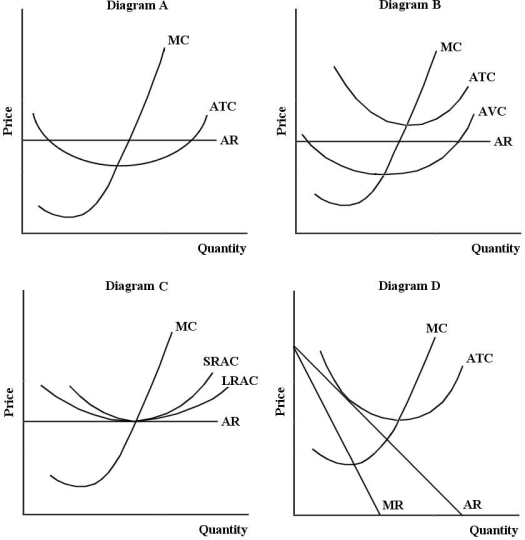
-Refer to Figure 11- 2.Diagram C depicts a typical firm in long- run equilibrium in
A) monopolistically competitive industry.
B) monopolistic industry.
C) an imperfectly competitive industry
D) a perfectly competitive industry.
E) oligopolistic industry.
Correct Answer:
Verified
Q1: The diagram below shows selected cost and
Q2: The diagram below shows demand and cost
Q4: One prediction about monopolistic competition is that
Q5: The diagram below shows demand and cost
Q6: In a monopolistically competitive industry,the freedom of
Q7: Suppose there are many independent dry cleaners
Q8: A characteristic of a monopolistically competitive market
Unlock this Answer For Free Now!
View this answer and more for free by performing one of the following actions

Scan the QR code to install the App and get 2 free unlocks

Unlock quizzes for free by uploading documents