The diagram below shows demand and cost curves for a monopolistically competitive firm.
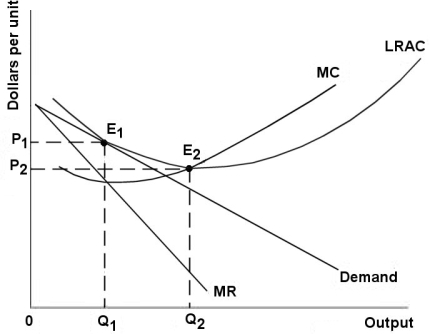 FIGURE 11- 3
-Refer to Figure 11- 3.A monopolistically competitive firm is allocatively inefficient because in the long- run equilibrium
A) MC is greater than price.
B) LRAC is not at its minimum.
C) price is greater than LRAC at Q1.
D) price is greater than MC at Q1.
E) None of the above - the long- run equilibrium is allocatively efficient.
Correct Answer:
Verified
Q43: The main difference between perfect competition and
Q44: Which of the following products is best
Q45: One difference between a perfectly competitive market
Q46: The diagram below shows demand and cost
Q47: Tacit collusion in an oligopolistic industry
A)results in
Q49: The excess- capacity theorem predicts that
A)long- run
Q50: Suppose Proctor and Gamble introduces a new
Q51: If entry into a monopolistically competitive industry
Q52: In Canada,concentration ratios are the highest in
A)petroleum
Q53: A monopolistically competitive firm has some degree
Unlock this Answer For Free Now!
View this answer and more for free by performing one of the following actions

Scan the QR code to install the App and get 2 free unlocks

Unlock quizzes for free by uploading documents