The figure below shows the demand schedule and demand curve for a product produced by a single- price monopolist.
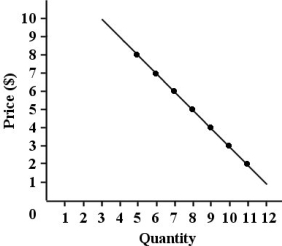 FIGURE 10- 1
-If a single- price monopolist's price equals marginal cost,the firm
A) will find it more profitable to produce a greater output.
B) is producing where MR = MC and thus is maximizing profits.
C) should definitely shut down.
D) could increase its profits by lowering output and raising price.
E) should maintain its current price because it is a price taker.
Correct Answer:
Verified
Q17: Q52: Suppose that a single- price monopolist Q53: The marginal revenue curve facing a single- Q54: At the profit- maximizing level of output Q55: A number of firms agreeing together to Q56: The diagram below shows total revenue for Q58: TABLE 10- 2 Your food- services Q59: A firm is best described as a Q60: TABLE 10- 1 Q62: If a competing firm is able to![]()
![]()
Unlock this Answer For Free Now!
View this answer and more for free by performing one of the following actions

Scan the QR code to install the App and get 2 free unlocks

Unlock quizzes for free by uploading documents