The diagram below shows total revenue for a single- price monopolist.
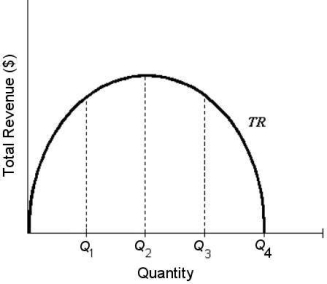 FIGURE 10- 3
-Refer to Figure 10- 3.The firm's marginal revenue at Q1 is
A) positive and rising.
B) zero.
C) negative and falling.
D) positive but falling.
E) not determinable from the diagram.
Correct Answer:
Verified
Q17: Q51: The diagram below shows total revenue for Q52: Suppose that a single- price monopolist Q53: The marginal revenue curve facing a single- Q54: At the profit- maximizing level of output Q55: A number of firms agreeing together to Q57: The figure below shows the demand Q58: TABLE 10- 2 Your food- services Q59: A firm is best described as a Q60: TABLE 10- 1 ![]()
![]()
Unlock this Answer For Free Now!
View this answer and more for free by performing one of the following actions

Scan the QR code to install the App and get 2 free unlocks

Unlock quizzes for free by uploading documents