The figure below shows the demand schedule and demand curve for a product produced by a single- price monopolist.
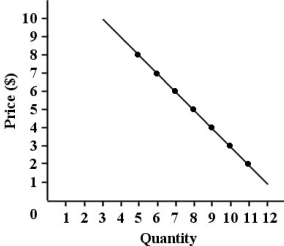 FIGURE 10- 1
-It is common for a cartel to collapse when one or more firms in the cartel
A) is much larger than other cartel members.
B) exceed its output quota.
C) exit the industry.
D) produce more efficiently than other member firms.
E) increase its price above the monopoly price.
Correct Answer:
Verified
Q98: FIGURE 10- 4 Suppose a monopolist faces
Q99: The diagram below shows a pharmaceutical firm's
Q100: TABLE 10- 2 Your food- services
Q101: FIGURE 10- 4 Suppose a monopolist faces
Q102: TABLE 10- 2 Your food- services
Q104: The figure below shows the demand
Q105: Suppose that a single- price monopolist
Q106: The figure below shows the demand
Q107: FIGURE 10- 4 Suppose a monopolist faces
Q108: FIGURE 10- 4 Suppose a monopolist faces
Unlock this Answer For Free Now!
View this answer and more for free by performing one of the following actions

Scan the QR code to install the App and get 2 free unlocks

Unlock quizzes for free by uploading documents