The figure below shows the demand schedule and demand curve for a product produced by a single- price monopolist.
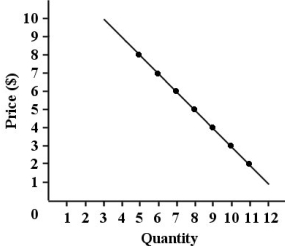 FIGURE 10- 1
-Refer to Figure 10- 1.Suppose this single- price monopolist is initially selling 9 units at $4 each and then reduces the price of the product to $3.By making this change,the firm is giving up revenue of on the original number of units sold and gaining revenue of _ on the additional units sold.Its marginal revenue is therefore .(All figures are dollars)
A) 3; 9; 6
B) 40; 27; - 13
C) 34; 28; - 6
D) 9; 3; - 6
E) 30; 36; 6
Correct Answer:
Verified
Q103: The figure below shows the demand
Q104: The figure below shows the demand
Q105: Suppose that a single- price monopolist
Q106: The figure below shows the demand
Q107: FIGURE 10- 4 Suppose a monopolist faces
Q108: FIGURE 10- 4 Suppose a monopolist faces
Q110: FIGURE 10- 4 Suppose a monopolist
Q111: Consider the following AR and MR curves
Q112: FIGURE 10- 4 Suppose a monopolist faces
Q113: Consider the following AR and MR curves
Unlock this Answer For Free Now!
View this answer and more for free by performing one of the following actions

Scan the QR code to install the App and get 2 free unlocks

Unlock quizzes for free by uploading documents