The diagram below shows two budget deficit functions for a hypothetical economy.
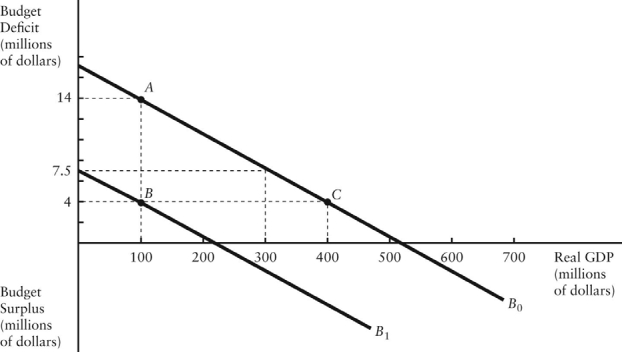 FIGURE 31-2
-Refer to Figure 31-2.Initially,suppose the economy is at point A on budget deficit function B0.Real GDP (Y) is $100 million.If the level of potential output (Y*) were $400 million,the structural budget deficit would be
A) $14 million.
B) $4 million.
C) negative.
D) -$10 million.
E) $0.
Correct Answer:
Verified
Q31: Suppose the stock of government debt in
Q42: The diagram below shows two budget deficit
Q42: The diagram below shows two budget deficit
Q44: The diagram below shows two budget deficit
Q46: The diagram below shows two budget deficit
Q62: The best measure of the change in
Q66: If the economy goes into a recession,the
Q72: Suppose the government's actual budget deficit is
Q86: Consider a closed-economy AD/AS macro model.A policy-induced
Q92: What economists call "government saving",or "public saving"
Unlock this Answer For Free Now!
View this answer and more for free by performing one of the following actions

Scan the QR code to install the App and get 2 free unlocks

Unlock quizzes for free by uploading documents