The diagram below shows the marginal costs of pollution abatement for two firms,Firm 1 and Firm 2.
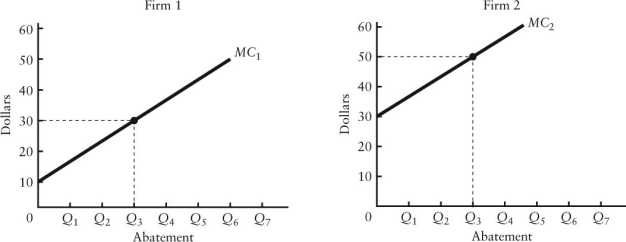 FIGURE 17-5
-Refer to Figure 17-5.Suppose each firm is currently abating pollution to the level Q3.Which of the following statements is true?
A) This outcome is efficient because both firms are abating the same amount.
B) This outcome is not allocatively efficient because the marginal benefits and marginal costs of abatement are not equated.
C) This outcome is not allocatively efficient because less than 100% abatement is being achieved.
D) This outcome is not productively efficient because one firm is abating more pollution than the other.
E) This outcome is not productively efficient because the total cost of achieving this level of abatement is not minimized.
Correct Answer:
Verified
Q60: The marginal benefit of reducing pollution and
Q61: All of the following are examples of
Q61: The diagram below shows the marginal cost
Q63: The diagram below shows the marginal costs
Q68: Federal regulation aimed at reducing greenhouse-gas emissions
Q70: The diagram below shows the marginal costs
Q71: Consider two firms,A and B,that must engage
Q72: Two firms,A and B,are legally required to
Q75: Automobile emissions standards are an example of
A)direct
Q79: Direct controls for reducing pollution can be
Unlock this Answer For Free Now!
View this answer and more for free by performing one of the following actions

Scan the QR code to install the App and get 2 free unlocks

Unlock quizzes for free by uploading documents