The diagram below shows the marginal cost of pollution abatement for two firms,Firm X and Firm Y.
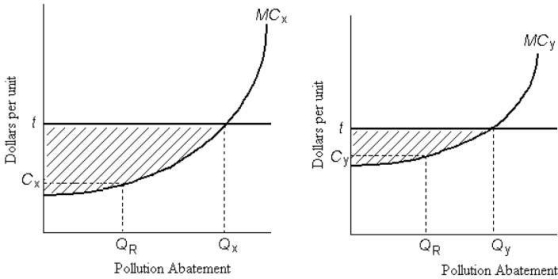 FIGURE 17-6
-Refer to Figure 17-6.Firms X and Y have an emissions tax of $t imposed on each unit of pollution they produce.If Firm X chooses to abate QX units of pollution,the total cost of its abatement is
A) tax amount t multiplied by the maximum possible level of pollution abatement.
B) area beneath the marginal cost of pollution abatement curve.
C) area below the horizontal line at t and above the MC of pollution abatement curve.
D) tax amount t multiplied by the level of pollution abatement,QX.
E) area beneath the marginal cost of pollution abatement curve up to QX.
Correct Answer:
Verified
Q87: The diagram below shows the marginal costs
Q92: The diagram below shows the marginal costs
Q94: Private and competitive markets could produce efficient
Q96: The diagram below shows the marginal cost
Q98: A potential disadvantage of emissions taxes versus
Q99: If residential garbage collection were financed by
Q103: A paper mill discharges chemicals into a
Q106: As a method of pollution control,tradable emissions
Q108: If emissions permits are traded freely between
Q111: Economists often argue that a system of
Unlock this Answer For Free Now!
View this answer and more for free by performing one of the following actions

Scan the QR code to install the App and get 2 free unlocks

Unlock quizzes for free by uploading documents