The diagram below shows selected cost and revenue curves for a firm in a monopolistically competitive industry. 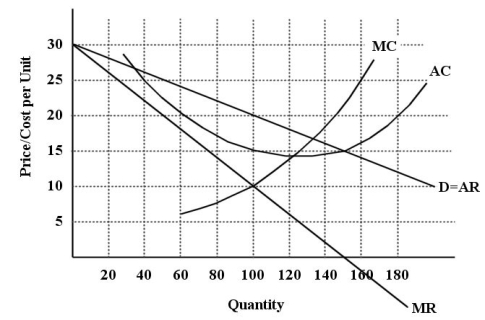 FIGURE 11-1
-Refer to Figure 11-1.What quantity of output will this profit-maximizing firm choose to sell?
A) 80 units
B) 100 units
C) 120 units
D) 140 units
E) 150 units
Correct Answer:
Verified
Q40: Consider the following characteristics of a particular
Q41: Which of the following are products that
Q42: The diagram below shows selected cost and
Q43: When a monopolistically competitive industry is in
Q44: A monopolistically competitive firm has some degree
Q46: The diagram below shows selected cost and
Unlock this Answer For Free Now!
View this answer and more for free by performing one of the following actions

Scan the QR code to install the App and get 2 free unlocks

Unlock quizzes for free by uploading documents