The diagram below shows selected cost and revenue curves for a firm in a monopolistically competitive industry.
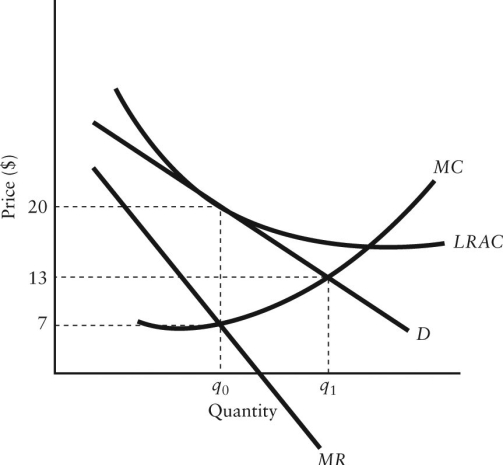 FIGURE 11-4
-Refer to Figure 11-4.Which of the following best describes this industry if all firms have the same cost and revenue curves and are producing output of q0?
A) firms are earning positive profits and new firms will enter the industry until all firms are operating at their minimum LRAC
B) all firms are earning positive profits and there is no incentive for firms to enter or exit the industry
C) firms are earning zero profits and there is no incentive for firms to enter or leave the industry
D) all firms will try to minimize costs and move toward minimum LRAC
E) firms are incurring losses and firms will exit this industry
Correct Answer:
Verified
Q42: The diagram below shows selected cost and
Q44: The diagram below shows demand and cost
Q44: A monopolistically competitive firm has some degree
Q46: The diagram below shows demand and cost
Q49: The diagram below shows demand and cost
Q50: The diagram below shows selected cost and
Q50: One prediction about monopolistic competition is that
Q52: The diagram below shows demand and cost
Q55: A monopolistically competitive firm is predicted to
Q79: The diagram below shows selected cost and
Unlock this Answer For Free Now!
View this answer and more for free by performing one of the following actions

Scan the QR code to install the App and get 2 free unlocks

Unlock quizzes for free by uploading documents