The diagram below shows selected cost and revenue curves for a firm in a monopolistically competitive industry. 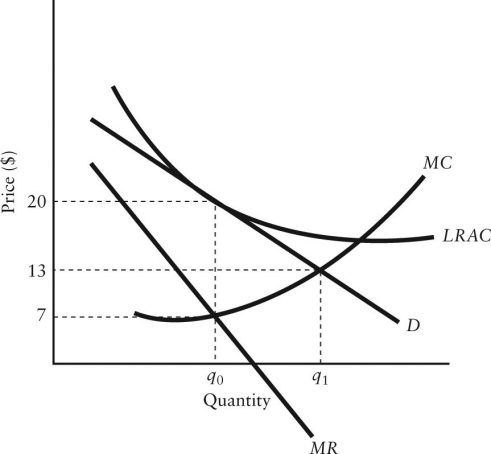 FIGURE 11-4
-Refer to Figure 11-4.Assuming this firm is producing its profit-maximizing level of output,what are the profits or losses being earned by this firm?
A) $0 per unit
B) $7 per unit
C) $13 per unit
D) $6 per unit
E) $20 per unit
Correct Answer:
Verified
Q74: In the long run,a monopolistically competitive firm
Q75: The diagram below shows demand and cost
Q76: With regard to the long-run equilibrium in
Q77: The diagram below shows demand and cost
Q78: If a monopolistically competitive industry is in
Q80: When a monopolistically competitive industry is in
Q81: For firms in an oligopoly,the main advantage
Q82: The payoff matrix below shows the payoffs
Q83: When the firms in an oligopoly are
Q84: Suppose two firms,Allstom from France,and Bombardier from
Unlock this Answer For Free Now!
View this answer and more for free by performing one of the following actions

Scan the QR code to install the App and get 2 free unlocks

Unlock quizzes for free by uploading documents