The diagram below shows demand and cost curves for a monopolistically competitive firm. 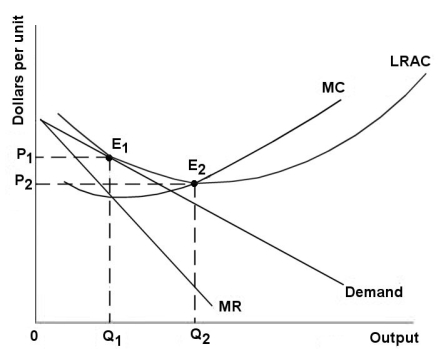 FIGURE 11-3
-Refer to Figure 11-3.In the long run,a monopolistically competitive firm will
A) make profit by producing at Q2 and charging price P1.
B) lose money by producing at Q1 and charging price P2.
C) maximize profit and make positive profit by producing at Q1 and charging price P1.
D) maximize profit but only break even by producing at Q1 and charging price P1.
E) maximize profit by producing output level Q2,the minimum point of its LRAC curve.
Correct Answer:
Verified
Q72: In long-run equilibrium,a monopolistically competitive industry operates
Q73: The diagram below shows selected cost and
Q74: In the long run,a monopolistically competitive firm
Q75: The diagram below shows demand and cost
Q76: With regard to the long-run equilibrium in
Q78: If a monopolistically competitive industry is in
Q79: The diagram below shows selected cost and
Q80: When a monopolistically competitive industry is in
Q81: For firms in an oligopoly,the main advantage
Q82: The payoff matrix below shows the payoffs
Unlock this Answer For Free Now!
View this answer and more for free by performing one of the following actions

Scan the QR code to install the App and get 2 free unlocks

Unlock quizzes for free by uploading documents