The diagram below shows selected cost and revenue curves for a firm in a monopolistically competitive industry. 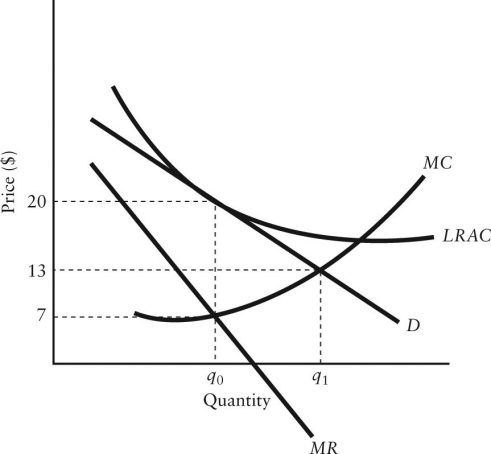 FIGURE 11-4
-Refer to Figure 11-4.How is the excess-capacity theorem demonstrated in this diagram?
A) The short-run equilibrium occurs where the firm is producing output at  ,which is less than that corresponding to the lowest point on its LRAC curve.
B) The long-run equilibrium occurs where the firm is producing output at  ,which is the same as for a perfectly competitive industry.
C) In long-run equilibrium the firm is earning positive profits,but has unexploited economies of scale.
D) In long-run equilibrium,this firm has excess capacity because they are selling output at a price below their LRAC.
E) The long-run equilibrium occurs where the firm is producing output at  ,which is less than that corresponding to the lowest point on its LRAC curve.
Correct Answer:
Verified
Q68: The diagram below shows demand and cost
Q69: If firms are able to freely enter
Q70: The diagram below shows selected cost and
Q71: The diagram below shows selected cost and
Q72: In long-run equilibrium,a monopolistically competitive industry operates
Q74: In the long run,a monopolistically competitive firm
Q75: The diagram below shows demand and cost
Q76: With regard to the long-run equilibrium in
Q77: The diagram below shows demand and cost
Q78: If a monopolistically competitive industry is in
Unlock this Answer For Free Now!
View this answer and more for free by performing one of the following actions

Scan the QR code to install the App and get 2 free unlocks

Unlock quizzes for free by uploading documents