The diagram below shows selected cost and revenue curves for a firm in a monopolistically competitive industry. 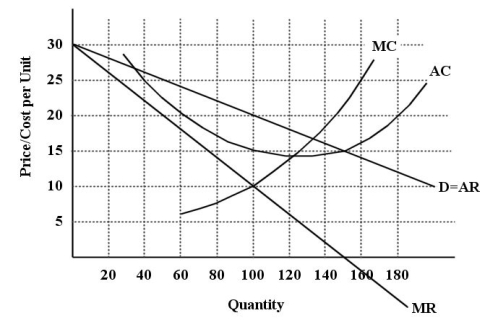 FIGURE 11-1
-Refer to Figure 11-1.If this firm is maximizing its profits,does the diagram depict a long-run equilibrium situation?
A) Yes,because this firm is producing where MC = MR and is earning zero profits.
B) Yes,because this firm is producing where MC = MR and is earning economic profits.
C) No,because this firm is earning profits which will attract new firms to this market.
D) No,because this firm is suffering losses and firms will exit this market.
E) No,because this firm is a natural monopoly.
Correct Answer:
Verified
Q66: The diagram below shows demand and cost
Q67: The diagram below shows demand and cost
Q68: The diagram below shows demand and cost
Q69: If firms are able to freely enter
Q70: The diagram below shows selected cost and
Q72: In long-run equilibrium,a monopolistically competitive industry operates
Q73: The diagram below shows selected cost and
Q74: In the long run,a monopolistically competitive firm
Q75: The diagram below shows demand and cost
Q76: With regard to the long-run equilibrium in
Unlock this Answer For Free Now!
View this answer and more for free by performing one of the following actions

Scan the QR code to install the App and get 2 free unlocks

Unlock quizzes for free by uploading documents