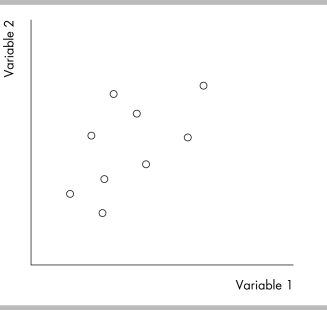
-The above figure is
A) a scatter diagram showing that there is no clear relationship between unemployment and inflation.
B) an economic model showing that when unemployment falls, inflation rises.
C) a time- series graph showing that when unemployment rises, so too does inflation.
D) a cross- section graph showing that when unemployment falls, so too does inflation.
Correct Answer:
Verified
Q382: A school board is studying how test
Q383: Q384: Q385: You have data for sales revenues for Q386: Which type of graph should be used Q388: A scatter diagram shows the Q389: Which type of graph is most useful Q390: Using a graph to plot family incomes Q391: You have data for real income per Q392: You notice that when interest rates increases,![]()
![]()
A) change in
Unlock this Answer For Free Now!
View this answer and more for free by performing one of the following actions

Scan the QR code to install the App and get 2 free unlocks

Unlock quizzes for free by uploading documents