Multiple Choice
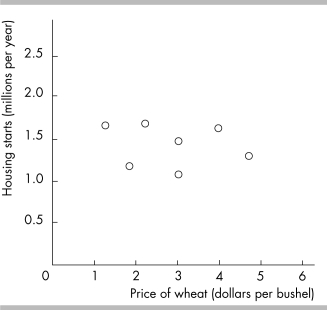
-The above figure graphs the price of a bushel of wheat and housing starts. The graph shows the variables are
A) related via an indirect relationship.
B) strongly negatively related.
C) not related.
D) strongly positively related.
Correct Answer:
Verified
Related Questions
Q378: Trend refers to
A) decreases but not increases
Q379: Inflation climbed steadily from 1952 to 1972.
Q380: A _ _ shows relative values for
Q381: You have data for the amount of
Q382: A school board is studying how test
Unlock this Answer For Free Now!
View this answer and more for free by performing one of the following actions

Scan the QR code to install the App and get 2 free unlocks

Unlock quizzes for free by uploading documents