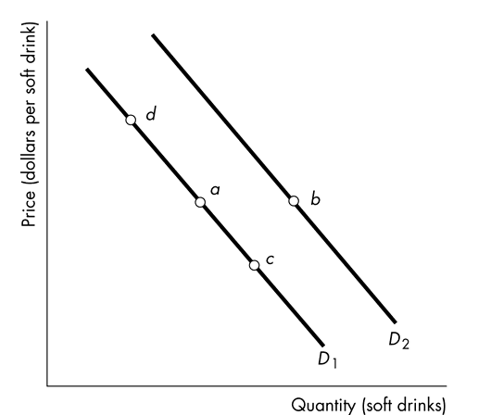
-Consider the demand curves for soft drinks shown in the figure above. A movement from point a
To point c represents
A) a decrease in quantity demanded.
B) a decrease in demand.
C) an increase in demand.
D) an increase in quantity demanded.
Correct Answer:
Verified
Q148: Some sales managers are talking shop. Which
Q149: Q150: A normal good is one Q151: The quantity of CDs that firms plan Q152: Because of increasing marginal cost, most supply Q154: The ʺlaw of supplyʺ refers to the Q155: A recession occurs and peopleʹs incomes decrease. Q156: The quantity supplied of a good or Q157: A fall in the price of a Q158: The ʺlaw of supplyʺ states that, other![]()
A) with a
Unlock this Answer For Free Now!
View this answer and more for free by performing one of the following actions

Scan the QR code to install the App and get 2 free unlocks

Unlock quizzes for free by uploading documents